Performance at higher loading rates.
Increasing loading rate: up to 1,000 BV/h
iA · P 425 testTested IEX
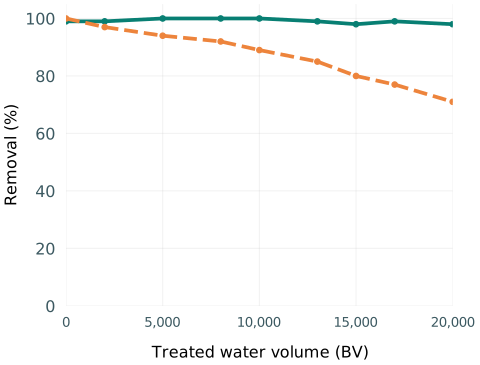
PFOA (C8)
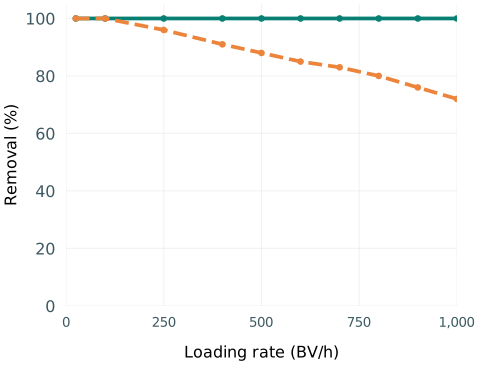
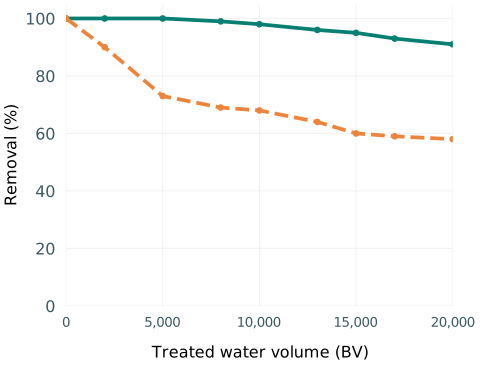
PFHxA (C6)
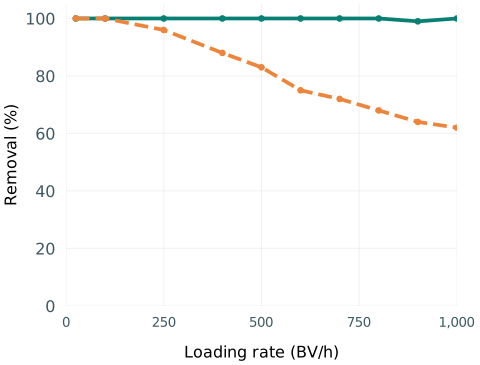
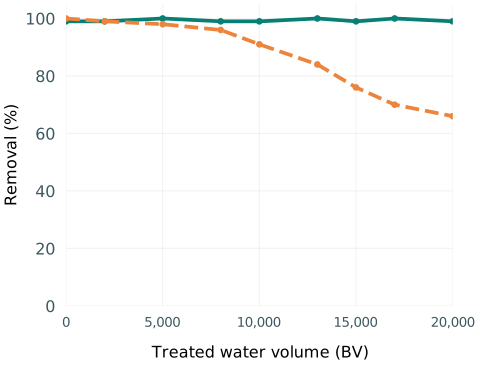
PFBS (C4)
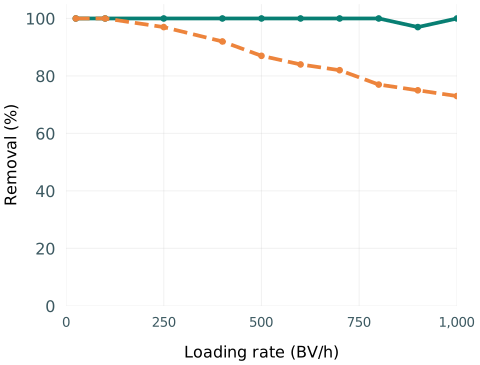
Simplified test curves based on the original charts. Values are approximate readings; lines between selected points indicate the trend.
What does the chart show?
As loading increases, the green iA curves remain close to 100%. The orange curves for the tested IEX decline. In this test, iA maintains high PFAS capture even with shorter water contact time.
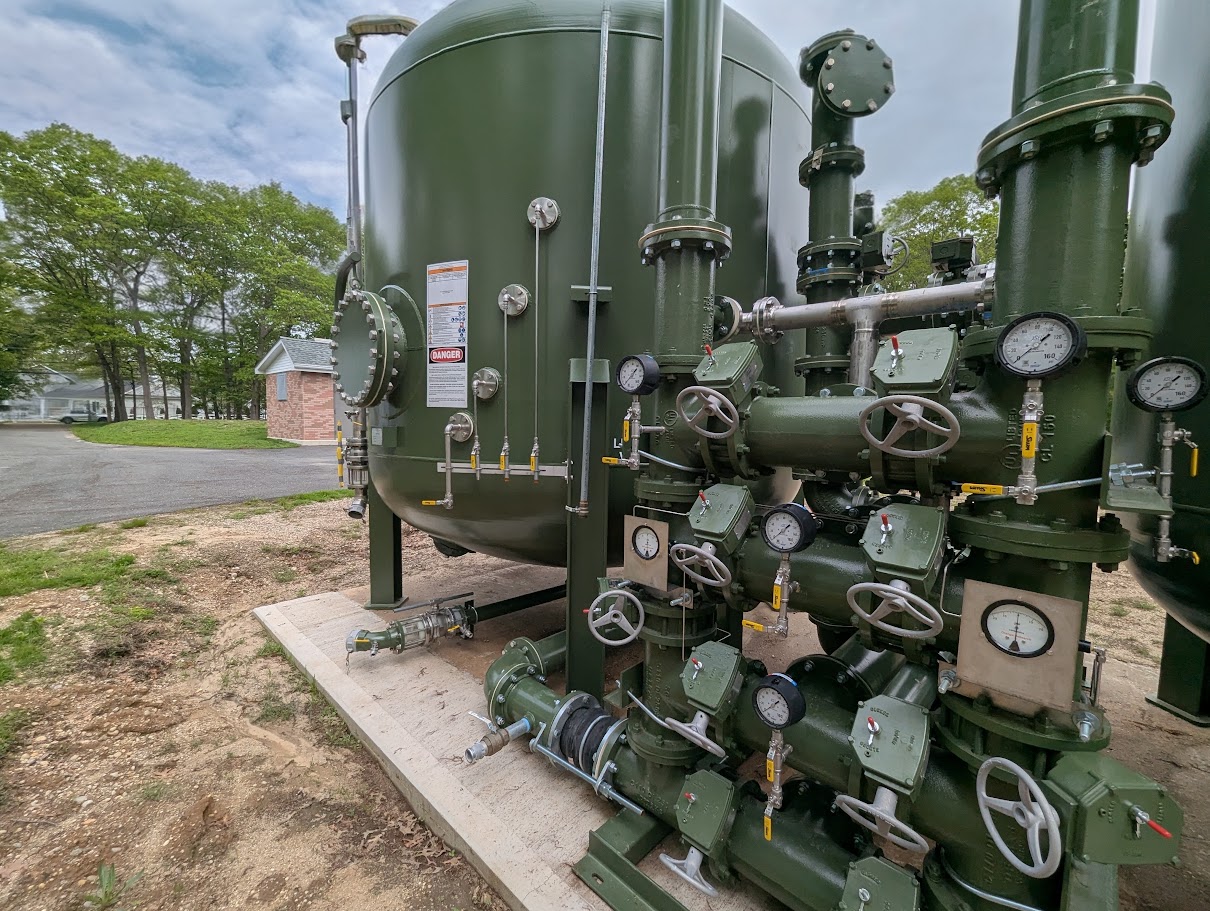
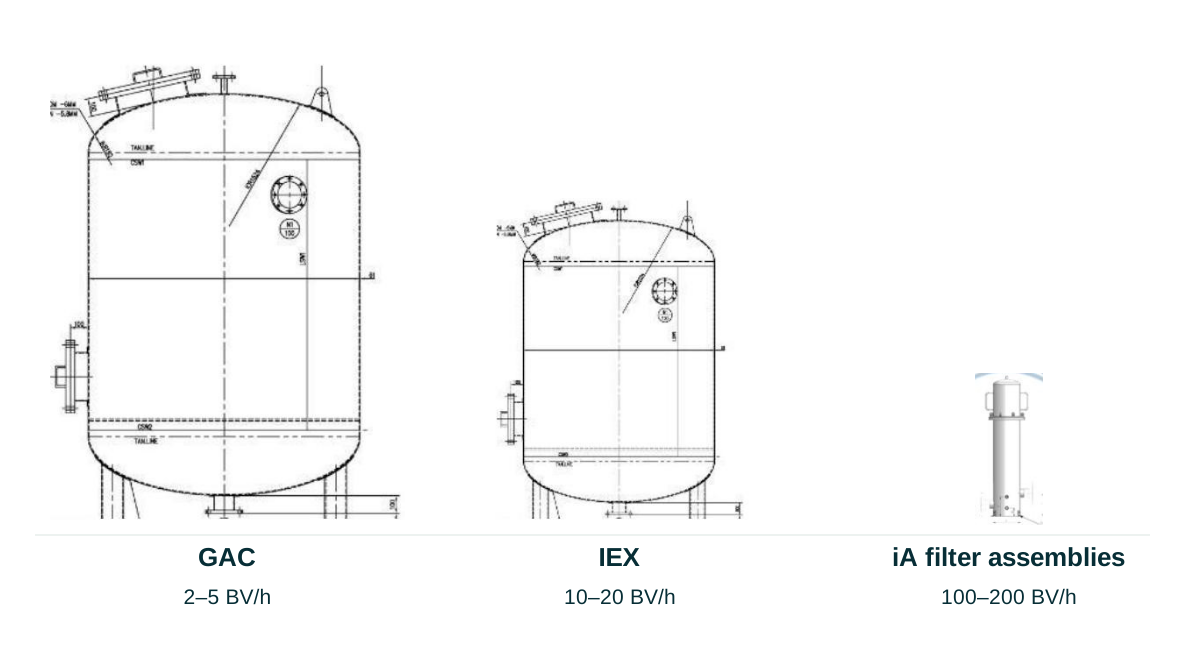
1,000 BV/h is a comparison point in the laboratory test. For industrial assemblies, we use a design range of 100–250 BV/h, confirmed by testing the actual water.