INSTRACTION TECHNOLOGY / SUPPORT IN SLOVENIA AND CROATIA

Performance demonstrated by measurements.

Laboratory tests of iA P 425 and the tested IEX. Charts, conditions and limitations of interpretation.

Preparing a filtration test in the laboratory

An advantage shown by measurements.

How well does iA capture PFAS at higher loading rates and after treating more water? Explore key comparative test results.

Simplified charts of instrAction laboratory tests compare iA P 425 and the tested IEX. Three PFAS compounds are shown; the results describe the stated media test, not a complete industrial assembly.

Samples for laboratory assessment of filtration efficiency

Performance at higher loading rates.

Increasing loading rate: up to 1,000 BV/h

iA · P 425 testTested IEX

PFOA (C8)
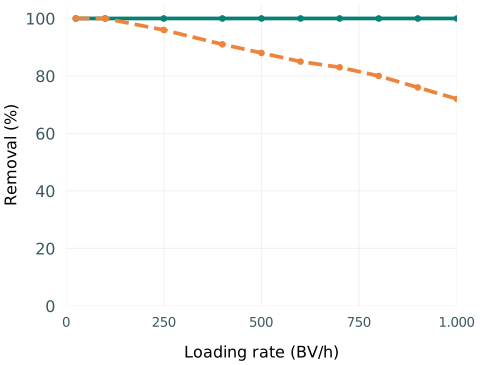
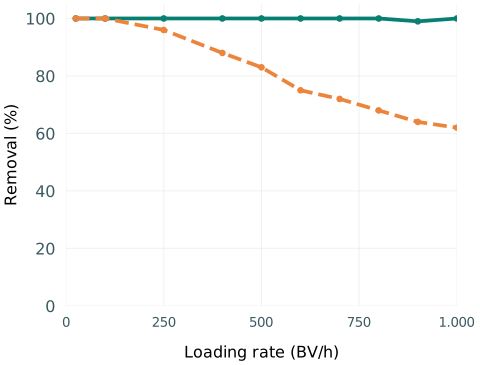
PFOA removal chart: iA maintains higher performance while the tested IEX declines with loading rate or treated volume. Approximate test trend.

PFHxA (C6)

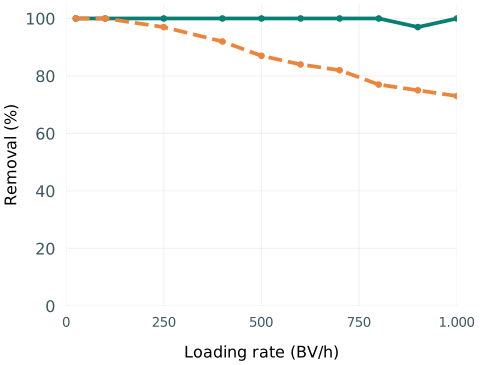
PFHxA removal chart: iA maintains higher performance while the tested IEX declines with loading rate or treated volume. Approximate test trend.

PFBS (C4)

PFBS removal chart: iA maintains higher performance while the tested IEX declines with loading rate or treated volume. Approximate test trend.

Simplified test curves based on the original charts. Values are approximate readings; lines between selected points indicate the trend.

What does the chart show?

As loading increases, the green iA curves remain close to 100%. The orange curves for the tested IEX decline. In this test, iA maintains high PFAS capture even with shorter water contact time.

1,000 BV/h is a comparison point in the laboratory test. For industrial assemblies, we use a design range of 100–250 BV/h, confirmed by testing the actual water.
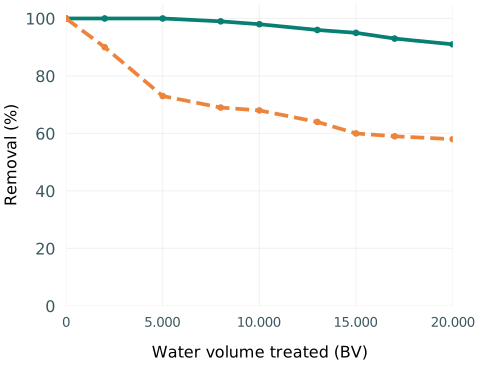
Sustained performance during operation.

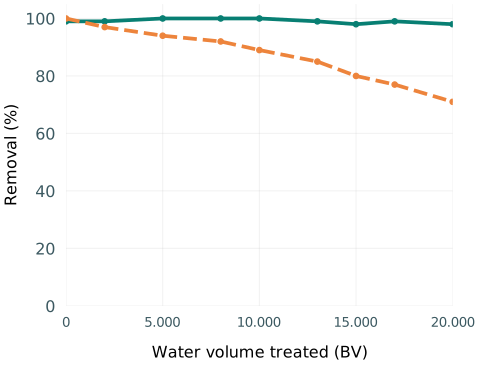
Treated volume: up to 20,000 BV at a constant 25 BV/h

iA · P 425 testTested IEX

PFOA (C8)

PFOA removal chart: iA maintains higher performance while the tested IEX declines with loading rate or treated volume. Approximate test trend.

PFHxA (C6)

PFHxA removal chart: iA maintains higher performance while the tested IEX declines with loading rate or treated volume. Approximate test trend.

PFBS (C4)

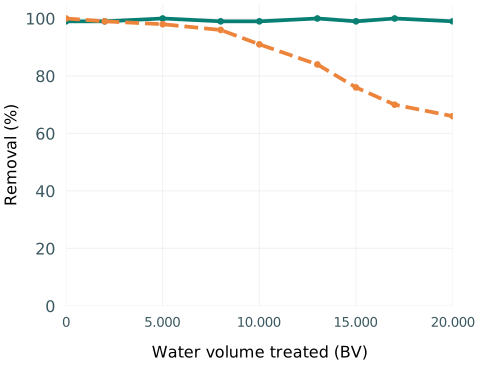
PFBS removal chart: iA maintains higher performance while the tested IEX declines with loading rate or treated volume. Approximate test trend.

Simplified test curves based on the original charts. Values are approximate readings; lines between selected points indicate the trend.

What does the chart show?

As more water passes through the medium, the tested IEX gradually loses efficiency. iA remains close to 100% for PFOA and PFBS, while PFHxA falls to approximately 90% towards the end. The difference demonstrates better retention of iA performance under the test conditions.

Binding sites designed for target substances.

iA technology uses functional binding sites for selective PFAS capture. The large number and accessibility of these sites enable instrAction’s rapid binding.

Advantage over the tested IEX

The tests show higher performance at greater loading rates and treated volumes. For operators, this offers the potential for a more compact design and better media utilisation.

Advantage over GAC

instrAction’s technology comparison assumes 2–5 BV/h for GAC and 100–200 BV/h for iA filter assemblies. A higher loading rate means less media volume at the same flow and the potential for a smaller installation.

What are you looking for?